This package allow you to install Pilea quickly and simply on a YunoHost server.
If you don’t have YunoHost, please see here to know how to install and enjoy it.
Please note that this app will install PHP 7.3
Overview
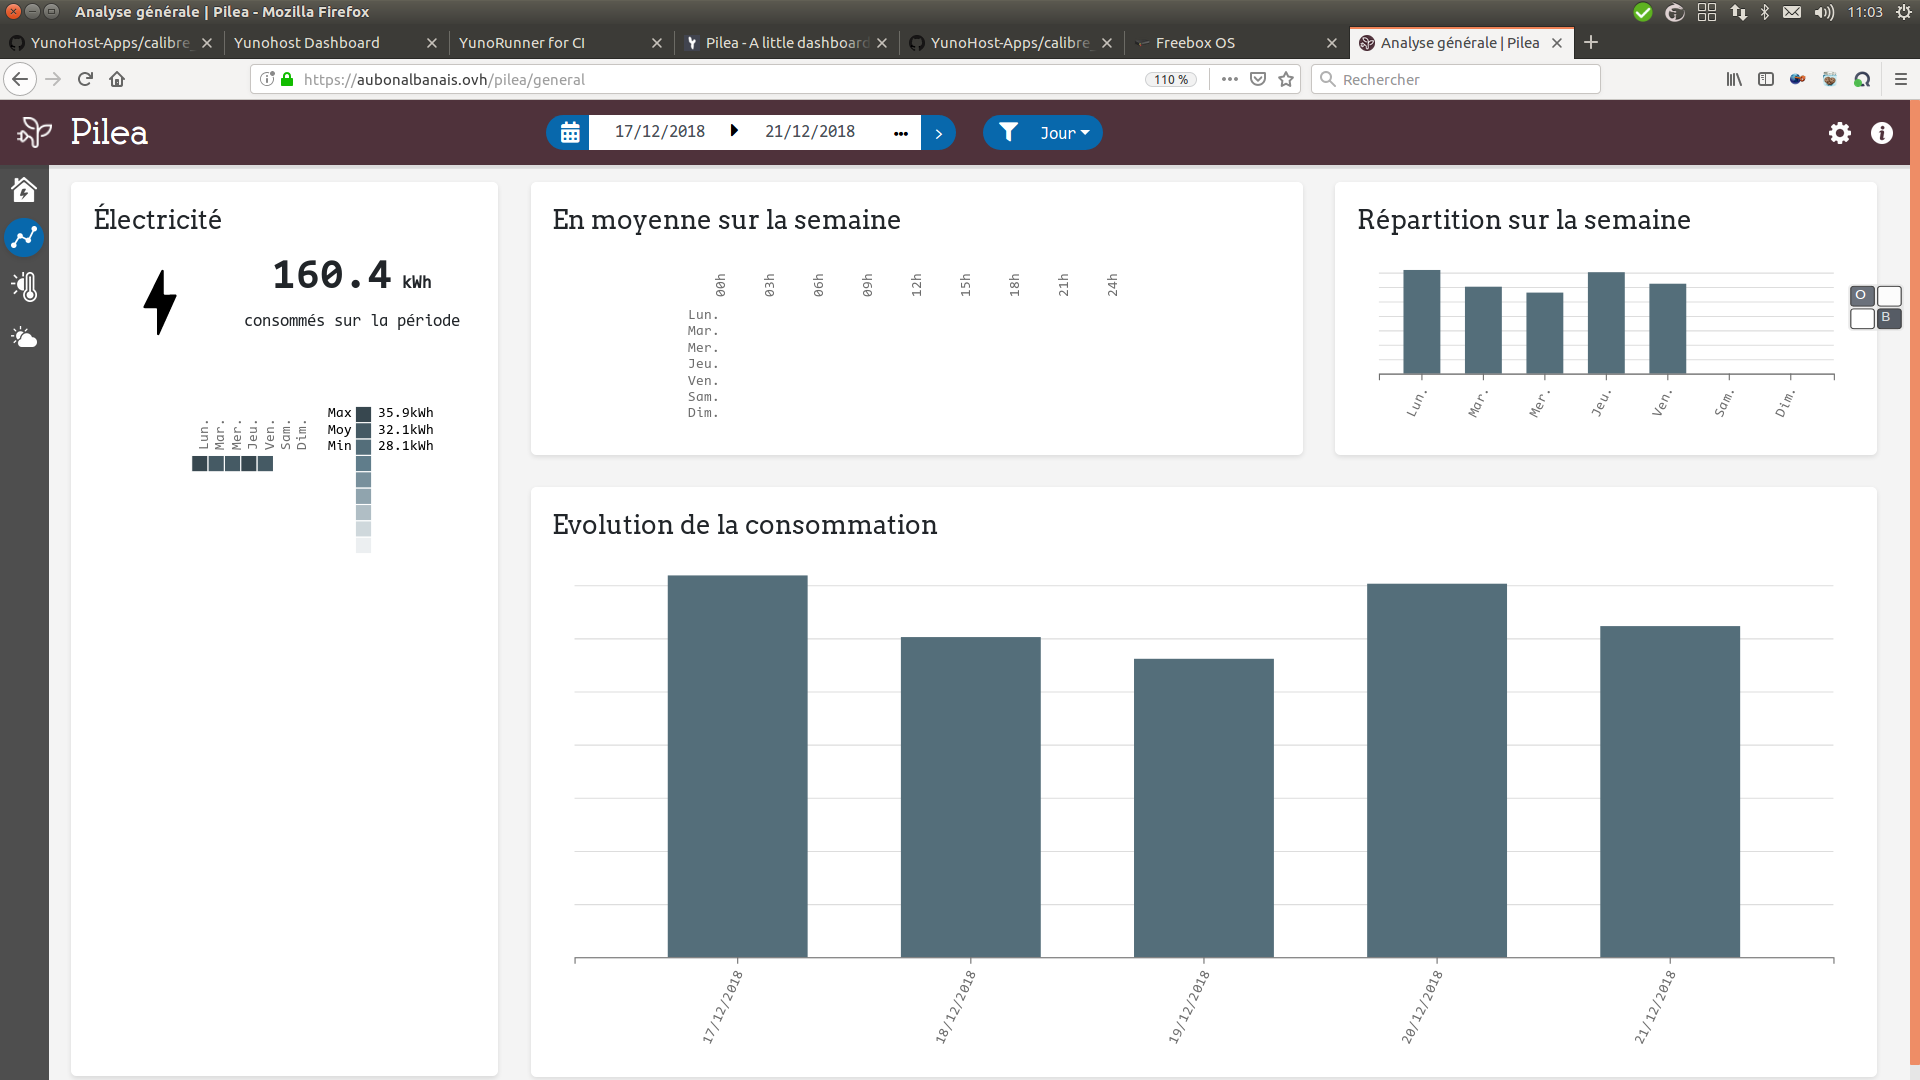
The idea of Pilea is to display electricity consumption and weather data on a little dashboard that allow the user to:
Better understand his electricity consumption
Analyse his electricity consumption throw weather data
Hello,
This seems a very interesting app. Thanks a lot!
I just installed it but for now but all graphes are empty, I assume I should wait for a while before it update? Does it retrieve data in the past once installed?
Also, I cannot find Paris in the meteo station list, only Orly? Where is the list fetch from? Is there a way to have more stations?
Also, it’s a little unclear what are the fields “Nom du compteur” and “Adresse du compteur” used for in the app?
I just installed it but for now but all graphes are empty, I assume I should wait for a while before it update?
yep ! ~10 minutes after you set up your enedis account, you should see data appears for yesterday
Does it retrieve data in the past once installed?
I didn’t developed this yet.
For Linky, data can be retrieve easily, I suppose I can add a field asking from when you want to retrieve data when you set up a Linky.
For MeteoFrance, data are archived after 2 weeks, but it’s may be possible, I didn’t check what archives look like and how i can fetch it
Also, I cannot find Paris in the meteo station list, only Orly? Where is the list fetch from? Is there a way to have more stations?
Meteo data come from MeteFrance Synop Data, and there’s only 62 observation stations (mostly airports):
Another feed could be implemented for Meteo data, but for now, these data give a good idea of what the weather was. Even if I understand that the temperature is certainly not the same in Orly that in the city-center of Paris
Also, it’s a little unclear what are the fields “Nom du compteur” and “Adresse du compteur” used for in the app?
It 's not used yet, in the future I want to let users add several Linky that’s why I need an name, but may be one field could be enough.
My Pilea is totally empty, I already activated the option “Courbe de charge”. But there’s nothing, not even the weather. Nothing…
I noticed you’ve fixed an error about the period in the upstream app. I’ve upgraded since.
But, still I have an error in the firefox console
jQuery.Deferred exception: period is not defined @https://crudelis.fr/pilea/js/selection.js:14:7
l@https://code.jquery.com/jquery-3.3.1.min.js:2:29373
a/</c<@https://code.jquery.com/jquery-3.3.1.min.js:2:29677
 undefined jquery-3.3.1.min.js:2:30920

ReferenceError: period is not defined[Learn More] selection.js:14:7
	<anonymous> https://crudelis.fr/pilea/js/selection.js:14:7
	l https://code.jquery.com/jquery-3.3.1.min.js:2:29373
	a/</c< https://code.jquery.com/jquery-3.3.1.min.js:2:29677
If you go back to config page, did the linky & meteo config still present ?
If the config is still there, maybe there’s a problem with cron job, you can try to run the command to fetch data manually: #PILEADIR#/bin/console pilea:fetch-data false
And see whats happened.
Note that data in the homepage should appear whatever the selection you made.
Hmm, indeed the “per hour” graph on the web site is also empty even when I activate the option…
Maybe I should wait a little after activation, or write them an email.
I’ll keep you posted.
Well in fact, the normal behavior of the command is to return nothing.
No there’s no verbose mode for now… but you can find logs in the /var/www/pilea/var/logs directory
You can run sudo -u pilea /var/www/pilea/bin/console pilea:fetch-data true '2018-12-21'
to force Pilea to fetch data for the date you want.
If everything is ok, it should take at least 10 seconds. If it’s less than 1 second then your feeds aren’t well configured.
Edit : I haven’t developed a correct validation for the linky form yet, maybe there’s an error on your password
But if it’s ok in the config page it should be good
I had a look to the log /var/www/pilea/var/logs/prod.log, it says:
[2018-12-23 00:22:44] request.CRITICAL: Uncaught PHP Exception Exception: "DateTime::__construct(): Failed to parse time string (undefined-undefined-Sun Dec 23 2018 00:21:51 GMT+0100 (CET) 23:59:59) at position 0 (u): The timezone could not be found in the database" at /var/www/pilea/src/AppBundle/Controller/DataApiController.php line 117 {"exception":"[object] (Exception(code: 0): DateTime::__construct(): Failed to parse time string (undefined-undefined-Sun Dec 23 2018 00:21:51 GMT+0100 (CET) 23:59:59) at position 0 (u): The timezone could not be found in the database at /var/www/pilea/src/AppBundle/Controller/DataApiController.php:117)"} []
I also had a look to the database, which is full of data for every hours.
So, it’s clear that my pilea can fetch the data, but can’t show them.
Looks like it doesn’t like my date format…
Hello,
So now the “per hour” graph is activated in the Enedis account, but all graphes are empty in the app, weather and energy…
I tryed to run the command you mention earlier #PILEADIR#/bin/console pilea:fetch-data false but nothing better happen.
Hi @enuts,
In fact, after a while they did reappear.
I think it’s because I’m on a raspberry and I was too quick on refreshing the page, without leaving enough time for it to display the data.
It’s all right now.
But I still don’t have any /var/log/pilea folder…
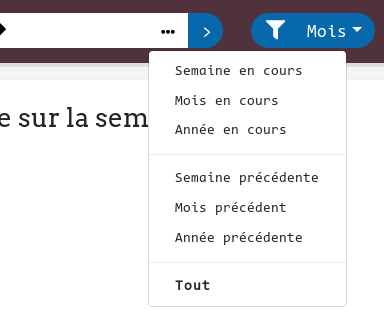
Indeed, playing with that menu seems to have unlock the datas on this panel and the others, except the home page.
But I’m on my phone, I can try it again later on my desktop browser and check the console if needed.