What type of hardware are you using: VPS bought online What YunoHost version are you running: 12.0.12 What app is this about: Node Exporter
Describe your issue
Hi, I’ve installed Node Exporter to use with the Prometheus to monitor system metrics. I’ve also setup the prometheus.yml file as per the Prometheus Docs. However the Node Exporter service fails with the following error:
Apr 04 12:55:21 systemd[1]: node_exporter.service: Main process exited, code=killed, status=31/SYS
Apr 04 12:55:21 systemd[1]: node_exporter.service: Failed with result 'signal'.
I couldn’t figure out why this happens. Does it have to do with installation or something similar? What should I do?
I’ve encountered the same issue. From what I understand, this is due to permission errors. The systemd service may need some change. However I have not tried modifying it so far.
Another things I would understand, I use a node_exporter app but with an external Prometheus, for this case the path to listen the api is /metrics I am not sure about the choice to use the path /api for local Prometheus…
Hello @rodinux. I don’t know what to say for that. I don’t use the /api. Maybe the /api provides some control functions over the Node Exporter, while the /metrics is only for gathering collected metrics information.
I’ve installed that branch to a local VM yunohost instance. The service is up and okay. Below is the logs of the service if you interested:
Thanks, I also tried on a server how it works. If Prometheus is a local one I need edit the prometheus config like this
scrape_configs:
  # The job name is added as a label `job=<job_name>` to any timeseries scraped from this config.
  - job_name: "node"

    # metrics_path defaults to '/metrics'
    # scheme defaults to 'http'.

    static_configs:
      - targets: ["localhost:9100"]
       # The label name is added as a label `label_name=<label_value>` to any timeseries scraped from this config.
        labels:
          app: "prometheus"
    metrics_path: /metrics
If prometheus is external, the port Ipv4 of the node can listen only the external IPv4, adding a CIDR /32 is more secure and the port for IPv6 of the node is blocked…
It looks like your prometheus is misconfigured for the nodes. You don’t need to specify the metrics_path for the node exporter. Prometheus is installed with preconfigured settings to target itself:
scrape_configs:
  # The job name is added as a label `job=<job_name>` to any timeseries scraped from this config.
  - job_name: "prometheus"

    # metrics_path defaults to '/metrics'
    # scheme defaults to 'http'.

    static_configs:
      - targets: ["localhost:9091"]
    metrics_path: /prometheus/metrics
You shouldn’t change that configuration to add a node exporter configuration. As per the prometheus docs Instead, you define a new job_name as node and add the node exporter configs below it.
Here is my definition’s whole picture as a reference:
scrape_configs:
  # The job name is added as a label `job=<job_name>` to any timeseries scraped from this config.
  - job_name: "prometheus"

    # metrics_path defaults to '/metrics'
    # scheme defaults to 'http'.

    static_configs:
      - targets: ["localhost:9091"]
    metrics_path: /prometheus/metrics

  - job_name: node
    static_configs:
      - targets: ["localhost:9100", "<external_node_exporter_domain>:9100"]
As you can see I defined a separate job_name called node and in the targets I defined both the internal (localhost:9100) and external (<external_node_exporter_domain>:9100) node exporter end points. Then I restarted the prometheus service.
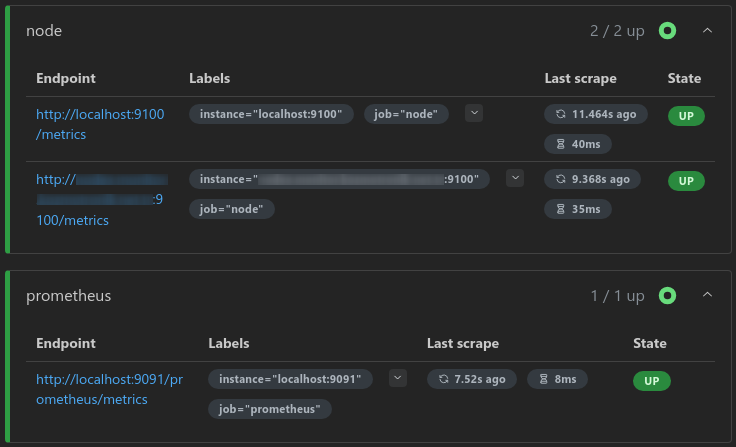
After restarting the prometheus, navigate to prometheus UI; click Status > Target Health from the top menu. Then you should see the health status both for your prometheus and node exporter targets. For example the mine looks like the following:
NOTE: The port 9100 should be unblocked in yunohost firewall settings in order the connections to success.
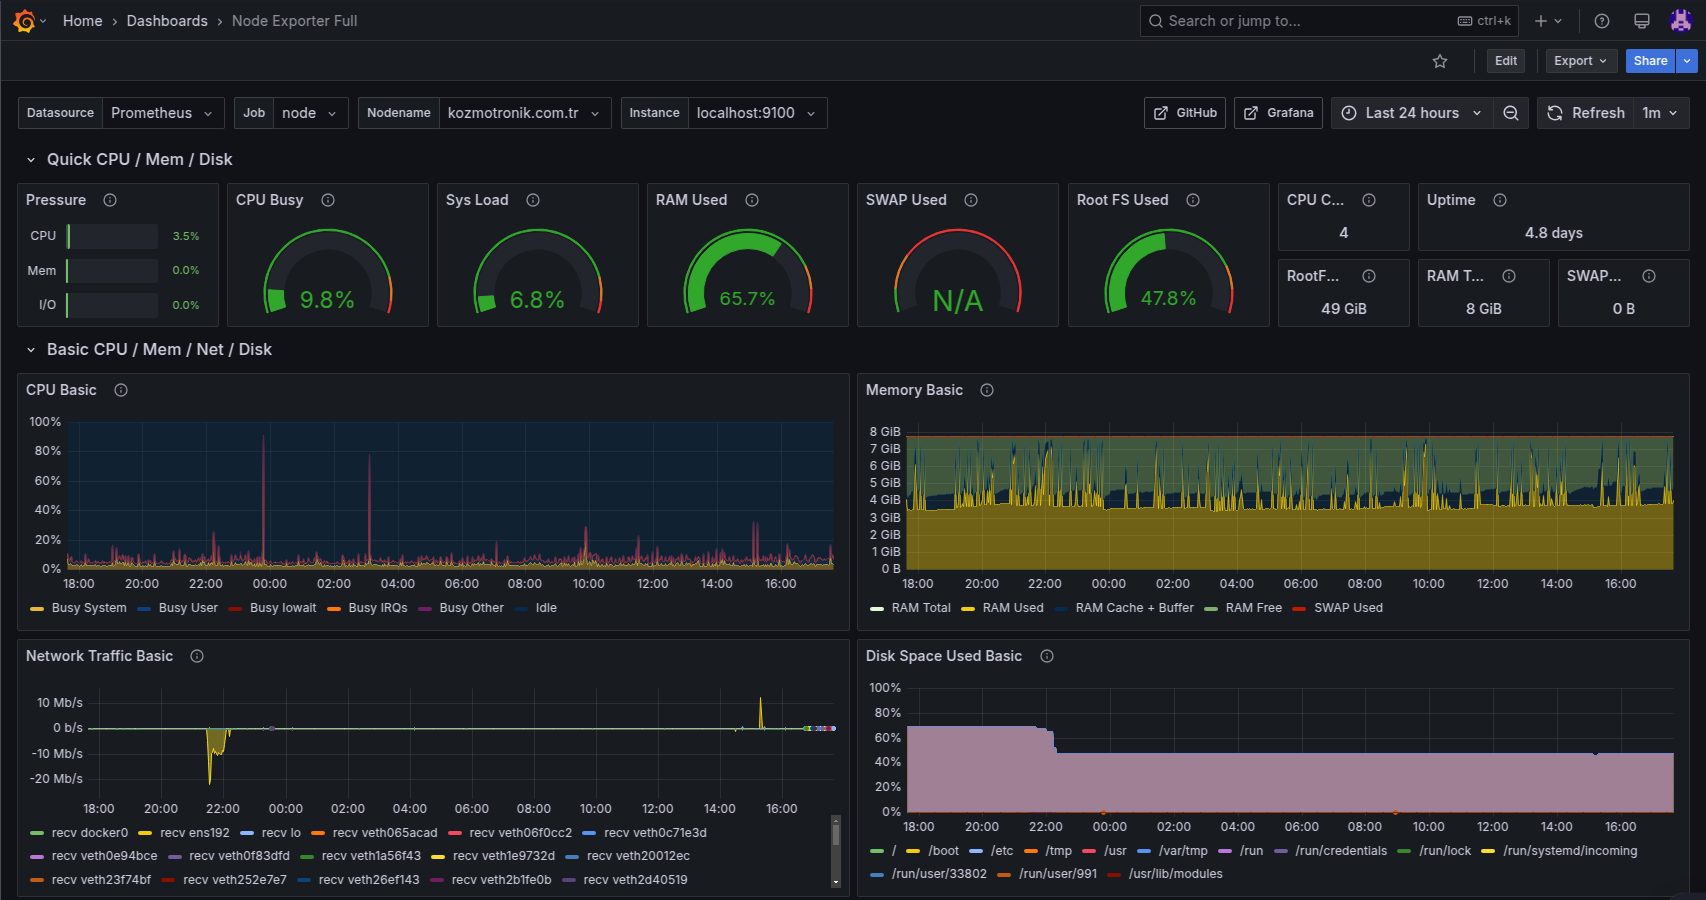
There are 2 nodes I configured for the node exporter, and the pre-configured prometheus node. They are all up and healthy. Node exporter + prometheus + grafana make up really nice combo for monitoring your systems:
Oh, sorry @rodinux, it is beyond of my knowledge since I am not familiar enough with the yunohost scripts. Hence I am not able to agree or disagree.
However I do have a bit of bash programming experience. If you put the port as a variable it should be ok since the port numbers may vary depending on the port usage of the system. For example in my system that I mentioned in my previous answer, the prometheus port is assigned as 9091 while its default is 9090.